Mature volcanic plumes can go undetected when monitoring for SO2, but SO42- in the mature plume can cause health problems. This was seen following the Holuhraun eruption in Iceland 2014-15, where exposure to the mature plume is associated with an increase in register-measured health care utilization for respiratory disease by 23% (95% CI 19.7–27.4%) and for asthma medication dispensing by 19.3% (95% CI 9.6–29.1%).
Abstract: The 2010 eruption of Eyjafjallajökull produced volcanic ash that was mostly deposited to the south and east of the volcano, with the thickest deposits closest to the eruption vents. For months following the eruption there were numerous reports of resuspended volcanic ash made by weather observers on the ground. A saltation sensor (SENSIT) and an optical particle counter (OPC) located on the southern side of Eyjafjallajökull measured posteruptive particulate matter (PM) saltation and suspension events, some of which were also observable by satellite imagery. During the autumn/winter following the eruption, visible satellite images and the SENSIT show that PM measured by the OPC was only detected when winds had a northerly component, making the source on the slopes of Eyjafjallajökull. During the largest observed events, particles >10 μm were suspended but measured in extremely low concentrations (<1 particle per centimeter cubed). The saltation measurements, however, show high concentrations of particles >100 μm in size during these events. During the largest events, winds were at least 5 m s−1 with a relative humidity < 70%. Ground conditions in Iceland change quickly from unfavorable to favorable for the suspension of particles. It is hypothesized that this is due to the porosity of the surface material allowing water to filter through quickly as well as the fast drying time of surface material. The high moisture content of the atmosphere and the ground do not appear to be a deterrent for large PM events to occur in Iceland.
Mary K. Butwin, Sibylle von Löwis, Melissa A. Pfeffer, Pavla Dagsson-Waldhauserova, Johann Thorsson and Throstur Thorsteinsson. 2020. Influence of Weather Conditions on Particulate Matter Suspension following the 2010 Eyjafjallajökull Volcanic Eruption. Earth Interact., 24(6): 1–16. https://doi.org/10.1175/EI-D-20-0006.1
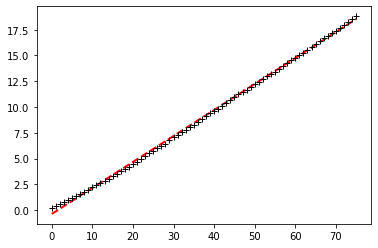
The number of cases is now about 29 million and is expected to reach 30 millions in about 4 days given the behaviour the past few weeks (see below; around 18 September).
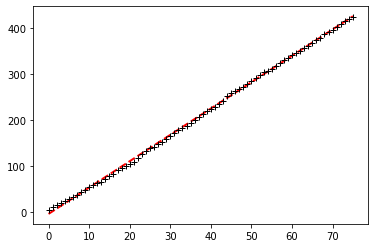
The number of deaths is now about 924 thousand and is expected to reach 1 million in about 13 days (around 27 September).
Cumulative number of deaths since 1 July 2020. Each day about 5715 deaths occur.Cumulative number of cases since 1 July 2020. Each day about 252 thousand cases are added
Using information from ECDC, here are a few plots showing the number of deaths and cases (highest numbers and per 100 thousand inhabitants), and cases in Iceland.
First is the number of reported deaths. China (3217) has the most deaths, but it is alarming to see how many deaths there are in Italy (1811).
Number of reported deaths per country (over 10 cases) as of 2020-03-16.
The list changes a bit if we look at this as number of deaths per 100 thousand inhabitants. San Marino (population around 34 thousand) has the highest, then Italy and Spain.
Reported (ECDC) deaths per 100 thousand inhabitants as of 2020-03-16 (population data for 2018).
For reported cases Iceland follows San Marino, as has been pointed out by the Icelandic authorities this statistic is mostly an indication of how many are tested, not how many are infected.
Reported cases per 100 thousand inhabitants as of 2020-03-16.
And in Iceland the number has been increasing, but concentrated efforts to slow the spreading seem to have worked quite well.
Reported (ECDC) cases in Iceland as of 2020-03-16. Blue columns cumulative sum of cases and red dots are the daily number of new cases.
Please note that there can be errors (although I hope not). Based on ECDC data available on the internet.
Black carbon, dust and plastic particles in snow and ice
This student opportunity is a collaborative research project between the University of Iceland (UI), the Finnish Meteorological Institute (FMI), and Landsvirkjun (LV).
The overall aim of this research project is to study the distribution and concentration of black carbon (BC), organic carbon (OC), dust and plastic particles in snow and ice on Icelandic glaciers. This will allow for better modeling of potential impact of those pollutants on glaciers and knowledge about their sources.
This MS project is funded for 4-5 months as a summer employee at Landsvirkjun. This grant is most suitable for students that are finishing their required course work at the University of Iceland and need a project. New students can though apply and work on this project along with coursework.
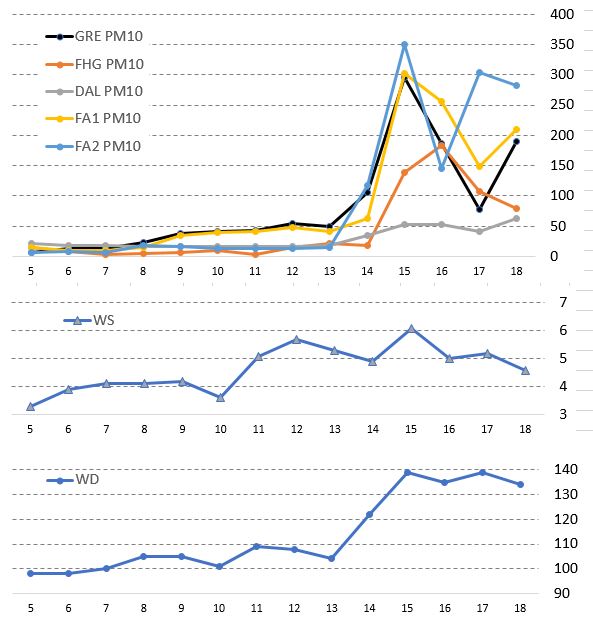
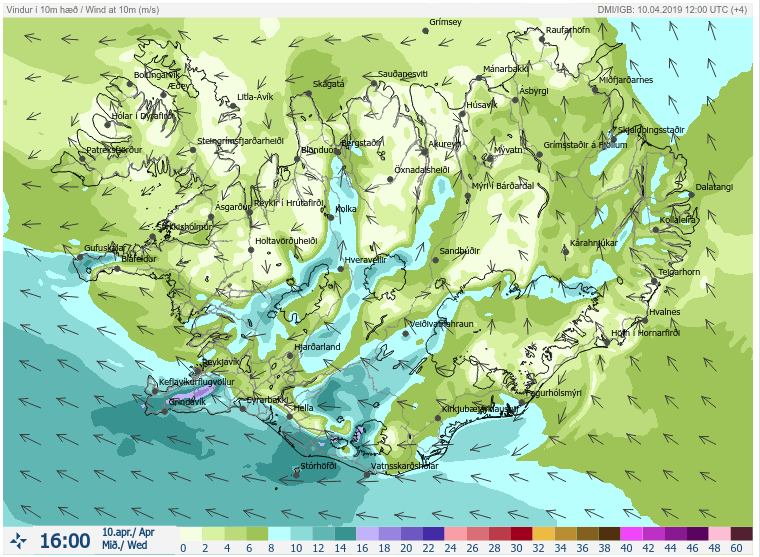
Very strong winds all around the south coast today. Wind direction directly from the north, and very dry air. Humidity even below 70% at Stórhöfði (data from IMO; vedur.is).
Figure 1. Wind speed at Kirkjubæjarklaustur (data from IMO; vedur.is). Figure 2. Humidity at Kirkjubæjarklaustur (data from IMO; vedur.is).
Quite similar at Stórhöfði, Vestmannaeyjar.
Figure 3. Wind speed and humidity at Stórhöfði (data from IMO; vedur.is).
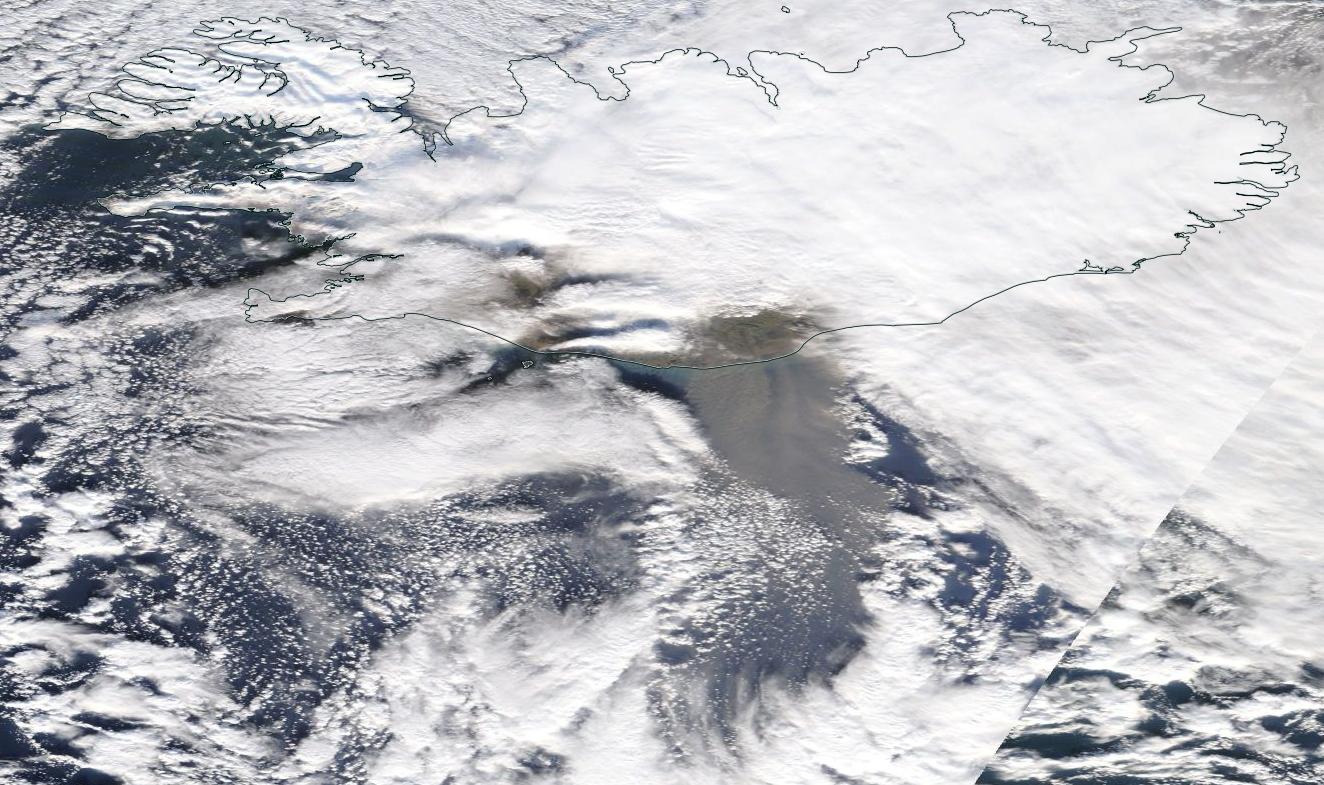
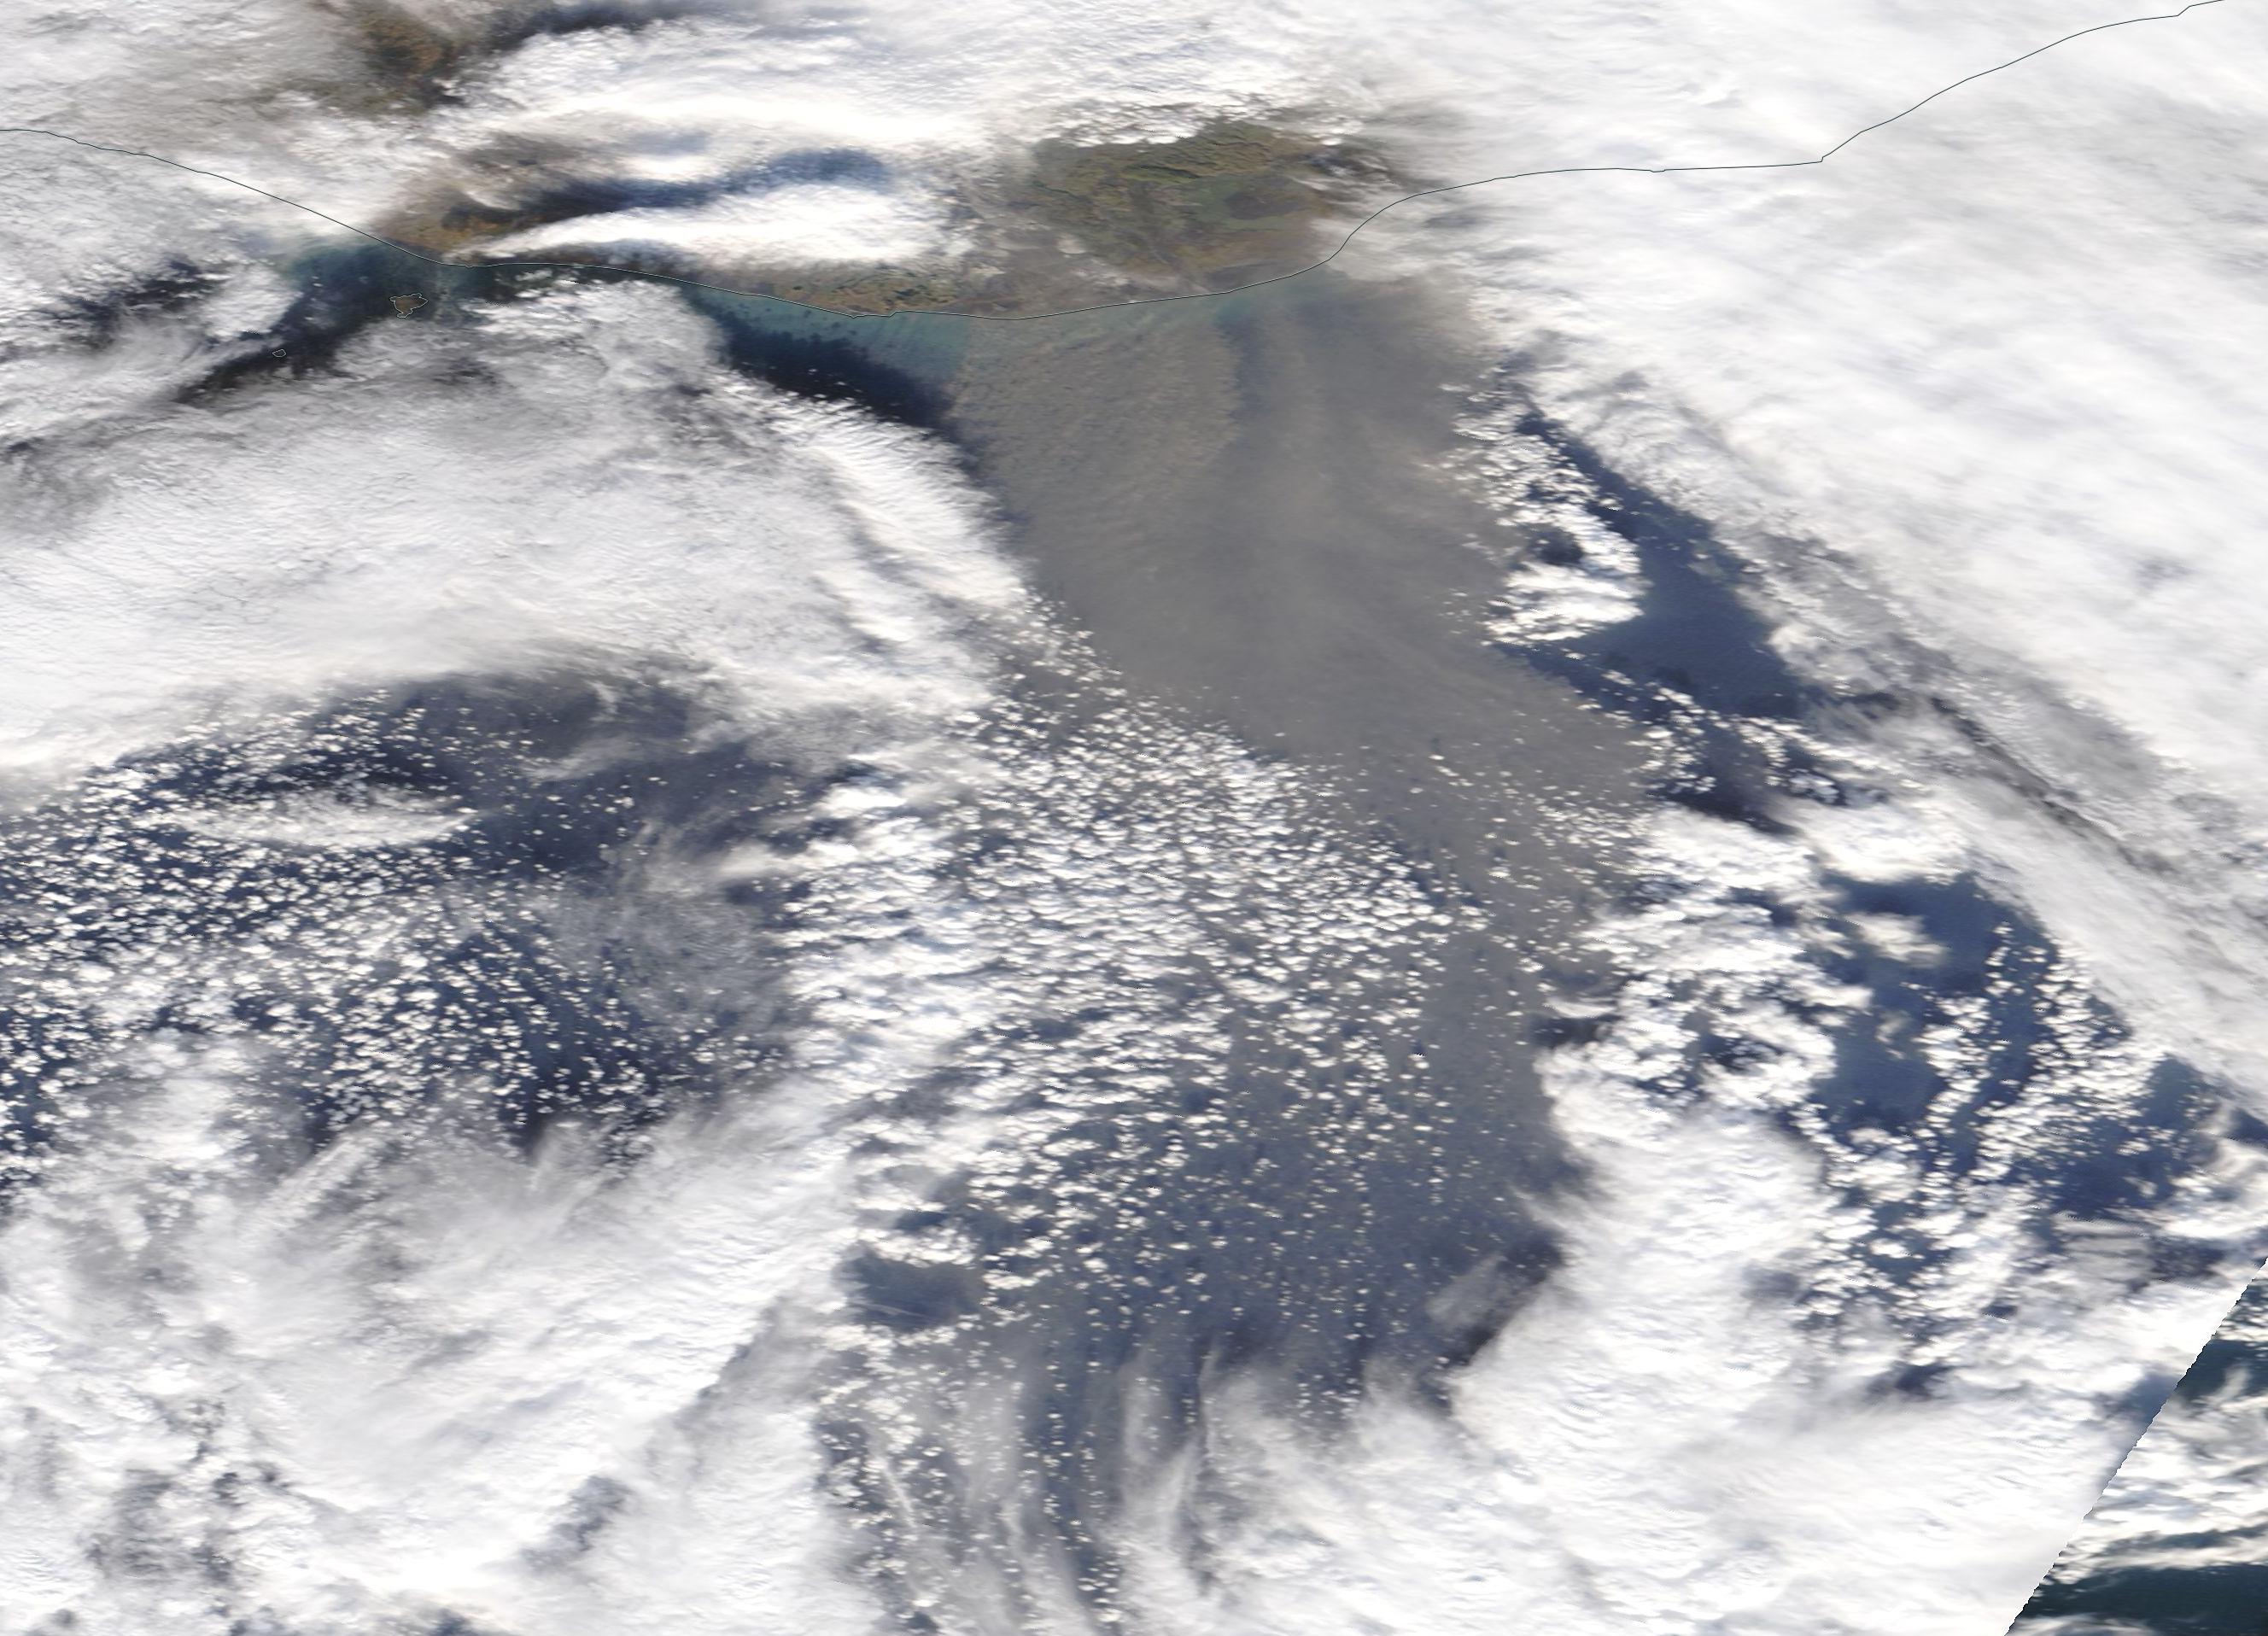
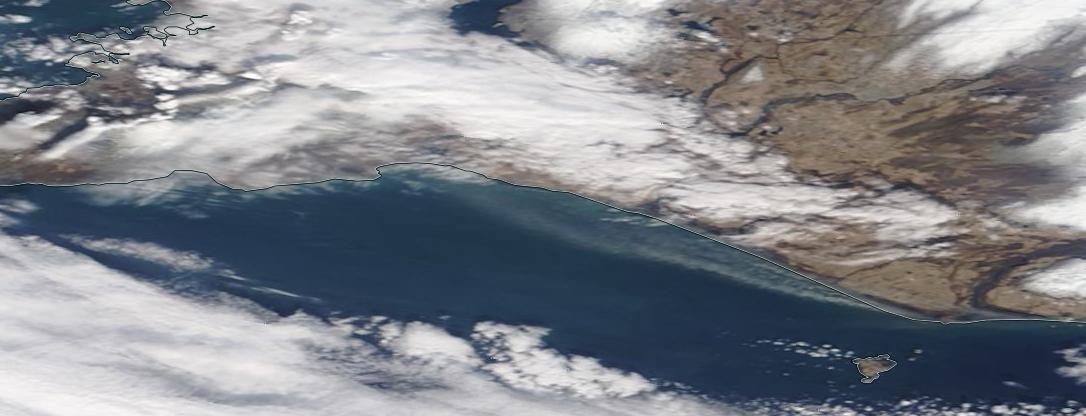
Modis images from 13:15 today, 24 October 2019 (NASA/WorldView).
Figure 4. MODIS images from 13:15 on 24 October 2019 (NASA/WorldView).
23 October 2019
There was a bit of activity yesterday, 23 October, also.